12 Evaluating tracks
So far, we have compared tracking methods by inspecting particular frames. For an overall comparison, we need to check which players are detected and whether their identities remain consistent across the sequence.
12.1 Annotation IDs and track IDs: toy example
For evaluation, we use annotations that give a box and an object ID for each labelled object in each frame. We assume that these object IDs are consistent: annotations with the same ID belong to the same object throughout the sequence.
Consider a small hypothetical example with two players visible in each of eight frames. The annotations use G1 for the red player and G2 for the black player. Each frame therefore has a box labelled G1 and a box labelled G2. The boxes may move between frames, but G1 always identifies the red player and G2 always identifies the black player.
Our tracker produces its own IDs, T1 and T2, without access to these annotation IDs. We use the annotations afterwards to evaluate its output. Because the two sets of IDs were assigned independently, we first need to establish which predicted track ID corresponds to which annotation object ID.
For this eight-frame toy example, suppose the players’ annotated boxes do not overlap. Each predicted box either agrees exactly with one annotation or is a spurious box away from both players. Each entry in a track row below names the annotation matched by that predicted box. A × means a prediction with no annotation match; a — means there is no prediction in that track’s row.
| Frame | 1 | 2 | 3 | 4 | 5 | 6 | 7 | 8 |
|---|---|---|---|---|---|---|---|---|
| T1 predictions | G1 | G2 | G1 | G1 | — | G1 | G2 | G1 |
| T2 predictions | G2 | G1 | G2 | × | G2 | G2 | G1 | G2 |
| Unmatched annotations | — | — | — | G2 | G1 | — | — | — |
There are 15 predicted boxes and 16 annotated boxes: 14 box matches, one unmatched prediction and two unmatched annotations. Detection precision is therefore \(14/15\approx0.933\) and detection recall is \(14/16=0.875\). These counts do not check whether T1 and T2 consistently follow the same players.
12.2 Choosing the identity pairing across the toy sequence
To calculate the identity precision and recall introduced by Ristani and colleagues, we choose a one-to-one pairing between predicted track IDs and annotation object IDs using the whole sequence. Each predicted ID can be paired with at most one annotation ID, and vice versa. We choose the pairing that gives the largest number of box matches over all frames.
For this example, we accept a box match if its IoU is at least 0.50. Start by comparing T1’s box with the G1 annotation in each frame. Their boxes agree exactly in frames 1, 3, 4, 6 and 8, giving IoU 1 in each of these frames. In frames 2 and 7, T1’s box is around the black player while G1’s annotation is around the red player, so their IoU is 0. T1 has no prediction in frame 5. This gives five accepted matches between T1 and G1.
We repeat this calculation for the other combinations of predicted and annotation IDs:
| Predicted track ID | Matches with G1 annotations | Matches with G2 annotations |
|---|---|---|
| T1 | 5 | 2 |
| T2 | 2 | 5 |
Outlined cells show the selected ID pairing.
The two possible complete one-to-one pairings give:
- T1 → G1 and T2 → G2: \(5+5=10\) accepted matches.
- T1 → G2 and T2 → G1: \(2+2=4\) accepted matches.
We therefore choose T1 → G1 and T2 → G2. This means that we evaluate T1’s boxes against the G1 annotations and T2’s boxes against the G2 annotations throughout all eight frames, including frames where the tracks follow the other player.
12.3 Identity precision and recall
Once we have selected the ID pairing, we can form identity-based versions of TP, FP and FN:
- IDTP: identity true positives — predicted boxes that match an annotation with the ID chosen for that track.
- IDFP: identity false positives — predicted boxes without such a match.
- IDFN: identity false negatives — annotated boxes without such a match.
With our selected pairing in the toy example, T1 gives five accepted identity matches with G1 and T2 gives five with G2. These ten matches are the identity true positives.
| Frame | 1 | 2 | 3 | 4 | 5 | 6 | 7 | 8 |
|---|---|---|---|---|---|---|---|---|
| T1 → G1 | G1 | G2 | G1 | G1 | — | G1 | G2 | G1 |
| T2 → G2 | G2 | G1 | G2 | × | G2 | G2 | G1 | G2 |
| Annotations with no matching detection | — | — | — | G2 | G1 | — | — | — |
This row shows the two missed annotation boxes. The other four IDFN come from the wrong-ID matches shown in the track rows above.
Green marks accepted identity matches; red marks identity errors. The chosen pairing is T1 → G1 and T2 → G2.
In each of frames 2 and 7, T1’s box fails to match the G1 annotation, and T2’s box fails to match the G2 annotation. Although each predicted box is correctly located around a player, its track ID is paired with the other player’s annotation ID. Each of these four wrong-ID box matches contributes one IDFP and one IDFN.
The spurious T2 prediction in frame 4 adds one IDFP. G2’s unmatched annotation in frame 4 and G1’s unmatched annotation in frame 5 each add one IDFN. The absent T1 prediction in frame 5 does not add an IDFP, because there is no predicted box to count. Our totals are therefore IDTP = 10, IDFP = 5 and IDFN = 6.
We calculate these scores using the totals over all tracks and frames in the sequence. Identity precision (IDP) is the number of accepted identity matches divided by the total number of predicted boxes. Identity recall (IDR) uses the same numerator, but divides by the total number of annotated boxes. These totals include boxes without an accepted match.
For our two-player, eight-frame toy example, there are 15 predicted boxes and 16 annotated boxes. Using these totals,
\[ \mathrm{IDP} =\frac{\mathrm{IDTP}}{\mathrm{IDTP}+\mathrm{IDFP}} =\frac{10}{10+5} =\frac{10}{15}\approx0.667, \]
\[ \mathrm{IDR} =\frac{\mathrm{IDTP}}{\mathrm{IDTP}+\mathrm{IDFN}} =\frac{10}{10+6} =\frac{10}{16}=0.625. \]
F1 combines precision and recall using their harmonic mean. IDF1 applies the same calculation to identity precision and recall:
\[ \mathrm{IDF1} =\frac{2\,\mathrm{IDP}\,\mathrm{IDR}}{\mathrm{IDP}+\mathrm{IDR}} =\frac{20}{31}\approx0.645. \]
12.4 Evaluating the basketball tracks
We can now evaluate the last-box and two-observation motion trackers over frames 50–100 of the basketball video. This gives 51 frames, with six annotated players in every frame, so there are \(6\times51=306\) annotated boxes. Each run creates eight predicted track IDs over this window. We include the detections stored under all eight IDs, including tracks that become inactive before frame 100.
The confidence cutoff of 0.50 gives 297 predicted boxes, while the cutoff of 0.40 gives 304. At each cutoff, both tracking methods use the same detections. We keep the court filter, tracking IoU threshold of 0.30 and three-miss inactivity rule unchanged.
For evaluation, we accept box overlaps with IoU at least 0.50. Detection precision and recall use the per-frame matching rule developed in the detection-evaluation chapter: maximise total IoU, then reject selected pairs below the threshold. For identity precision and recall, we instead choose the track-to-annotation ID pairing over all 51 frames, as in the worked example above.
| Tracking method | Confidence cutoff | Detection precision | Detection recall | Identity precision | Identity recall |
|---|---|---|---|---|---|
| Last-box | 0.50 | 0.976 | 0.948 | 0.852 | 0.827 |
| Two-observation motion | 0.50 | 0.976 | 0.948 | 0.852 | 0.827 |
| Last-box | 0.40 | 0.970 | 0.964 | 0.914 | 0.908 |
| Two-observation motion | 0.40 | 0.970 | 0.964 | 0.862 | 0.856 |
Bold marks the best value in each score column, including ties.
For example, last-box tracking at confidence cutoff 0.40 gives 278 accepted identity matches. The remaining 26 predicted boxes contribute to IDFP, and the remaining 28 annotated boxes contribute to IDFN. Thus,
\[ \mathrm{IDP}=\frac{278}{304}\approx0.914, \qquad \mathrm{IDR}=\frac{278}{306}\approx0.908. \]
Detection precision and recall assess matches between detections and annotations within each frame, not the tracking links between frames. At each confidence cutoff, these scores are identical for the two tracking methods because their boxes are unchanged. Lowering the cutoff recovers five additional detection matches, but also adds two unmatched predicted boxes. Detection recall therefore increases, while detection precision falls slightly. Last-box tracking at cutoff 0.40 has the highest identity precision and recall among these four runs.
At cutoff 0.50, the identity scores are also identical, despite the motion predictor avoiding the frame-66 switch. For evaluation, each annotated player is paired with one predicted track ID over the whole sequence.
Consider the red player’s annotations. At cutoff 0.50, T2 follows the red player earlier in the clip and T7 follows the red player later. T2 has 14 acceptable box overlaps with these annotations under last-box tracking and 18 under motion-based tracking. However, T7 has 29 in both runs, so the joint sequence-wide identity pairing still selects T7 for the red player in both cases.
| Method | Matches under T2 (earlier) | Matches under T7 (later) | ID paired with red |
|---|---|---|---|
| Last-box | 14 | 29 | T7 |
| Two-observation motion | 18 (+4) | 29 | T7 |
Frames 50–100: box matches with the red player’s annotations. Green marks the additional matches under T2, not a change in the selected pairing.
Motion extends T2’s earlier part of the red player’s history, but it does not join that part to T7’s later part. We cannot count T2’s overlaps as identity matches for red, because red is already paired with T7. The other chosen ID pairings and the total numbers of predicted and annotated boxes are also the same, so identity precision and recall do not change.
12.5 MOTA and HOTA
IDF1 combines identity precision and recall into a single score. MOTA and HOTA use information about tracking errors that these two numbers do not retain, so they can distinguish tracking outputs with identical identity precision and recall.
MOTA, or Multiple Object Tracking Accuracy, starts with detection false positives and false negatives: predicted boxes without matching annotations, and annotations without matching predicted boxes. It then adds a penalty whenever the track ID assigned to a player changes. This is an identity switch.
Returning to the eight-frame toy example, we now put the annotated players in the rows. Each entry names the predicted track whose box matches that player’s annotation. Each arrow marks an identity switch; changing back also counts.
| Frame | 1 | 2 | 3 | 4 | 5 | 6 | 7 | 8 |
|---|---|---|---|---|---|---|---|---|
| G1 annotations | T1 | → T2 | → T1 | T1 | — | T1 | → T2 | → T1 |
| G2 annotations | T2 | → T1 | → T2 | — | T2 | T2 | → T1 | → T2 |
| Unmatched predictions | — | — | — | T2 | — | — | — | — |
The eight arrows give eight identity switches, four for each player. G1 returns after its frame-5 gap with the same ID as before the gap, and G2 does the same after its frame-4 gap, so these returns add no switches. There is one detection false positive and two detection false negatives. These differ from the identity counts IDFP = 5 and IDFN = 6 calculated using a fixed ID pairing.
MOTA adds the detection errors and identity switches, divides by the total number of annotated boxes, and subtracts the result from 1. Writing IDSW for the number of identity switches, our toy example gives
\[ \mathrm{MOTA} =1-\frac{\mathrm{FP}+\mathrm{FN}+\mathrm{IDSW}}{\text{number of annotated boxes}} =1-\frac{1+2+8}{16} =0.3125. \]
MOTA is at most 1, but can be negative if the total error count exceeds the number of annotated boxes.
HOTA, or Higher Order Tracking Accuracy, combines a detection component and an association component. We first compare its detection component with precision and recall, using the same eight-frame toy example.
| Measure | Formula | Detection example |
|---|---|---|
| Binary classification accuracy | \(\frac{\mathrm{TP}+\mathrm{TN}}{\mathrm{TP}+\mathrm{TN}+\mathrm{FP}+\mathrm{FN}}\) | Not used here: there is no natural count of true-negative boxes. |
| Precision | \(\frac{\mathrm{TP}}{\mathrm{TP}+\mathrm{FP}}\) | \(14/15\approx0.933\) |
| Recall | \(\frac{\mathrm{TP}}{\mathrm{TP}+\mathrm{FN}}\) | \(14/16=0.875\) |
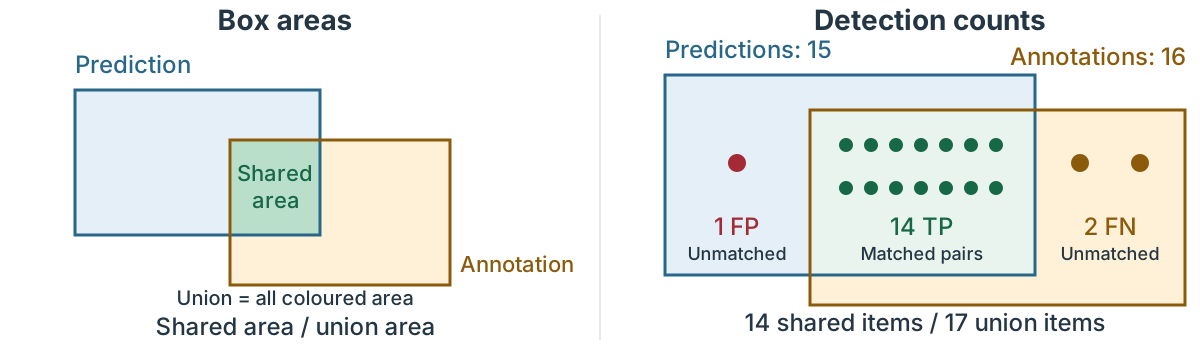
| HOTA’s detection score | \(\frac{\mathrm{TP}}{\mathrm{TP}+\mathrm{FP}+\mathrm{FN}}\) | \(14/17\approx0.824\) |
We used box IoU to compare two boxes by dividing their shared area by the area covered by either box. This intersection-over-union measure is also called the Jaccard index, and we can apply it to detection counts once we have matched the boxes.
For the Jaccard detection score, each matched prediction–annotation pair counts as one shared item. The 14 matches form the intersection, and adding the one unmatched prediction and two unmatched annotations gives a union of 17 items, so the score is 14/17. HOTA calls this component detection accuracy.
To see how HOTA’s association score works, start with a box match between G1 and T1. HOTA compares all G1 annotation boxes with all T1 prediction boxes across the sequence, including frames where they do not match. In our eight-frame toy example, the counts for this player–track pair are:
- Frames 1, 3, 4, 6 and 8 give five correct box matches, called true positive associations (\(\mathrm{TPA}=5\)).
- G1’s annotations in frames 2, 5 and 7 have no matching T1 prediction: three false negative associations (\(\mathrm{FNA}=3\)).
- T1’s predictions in frames 2 and 7 are around the black player, so they have no matching G1 annotation: two false positive associations (\(\mathrm{FPA}=2\)).
We divide the number of matches by the matches plus both kinds of unmatched box. This gives the association score, which is also a Jaccard index:
\[ \text{G1–T1 association score}=\frac{\mathrm{TPA}}{\mathrm{TPA}+\mathrm{FNA}+\mathrm{FPA}}=\frac{5}{5+3+2}=0.5. \]
| Frame | 1 | 2 | 3 | 4 | 5 | 6 | 7 | 8 |
|---|---|---|---|---|---|---|---|---|
| G1 annotations | G1 | G1 | G1 | G1 | G1 | G1 | G1 | G1 |
| Association score | 0.5 | 0.5 | 0.5 | 0.5 | 0.5 | |||
| T1 predictions | G1 | G2 | G1 | G1 | — | G1 | G2 | G1 |
Green links the five matches. Amber marks G1 annotations not matched by T1; red marks T1 predictions not matched to G1.
Each of the five G1–T1 box matches receives this score, because each uses the same complete histories of G1 and T1.
HOTA also compares G1 with T2, because those IDs have box matches in frames 2 and 7. Their complete histories give two correct matches, six false negatives and six false positives. The false positives for this comparison include T2’s five boxes around G2 and its spurious frame-4 box. Thus,
\[ \text{G1–T2 association score}=\frac{2}{2+6+6}=\frac17\approx0.143. \]
| Frame | 1 | 2 | 3 | 4 | 5 | 6 | 7 | 8 |
|---|---|---|---|---|---|---|---|---|
| G1 annotations | G1 | G1 | G1 | G1 | G1 | G1 | G1 | G1 |
| Association score | 1/7 | 1/7 | ||||||
| T2 predictions | G2 | G1 | G2 | × | G2 | G2 | G1 | G2 |
Green links the two matches. Amber marks G1 annotations not matched by T2; red marks T2 predictions not matched to G1.
Both G1–T2 matches receive this score. Repeating the comparison for G2 gives two more scores:
| Player–track pair | Box matches | Unmatched annotations | Unmatched predictions | Association score |
|---|---|---|---|---|
| G1–T1 | 5 | 3 | 2 | 1/2 |
| G1–T2 | 2 | 6 | 6 | 1/7 |
| G2–T1 | 2 | 6 | 5 | 2/13 |
| G2–T2 | 5 | 3 | 3 | 5/11 |
Each unmatched count in this table refers to the player–track pair in that row. To average over all 14 box matches, multiply each row’s score by its number of matches and divide the sum of those contributions by 14:
\[ \text{Association accuracy} =\frac{5(1/2)+2(1/7)+2(2/13)+5(5/11)}{14} \approx0.383. \]
For IDP and IDR, we selected one fixed ID pairing for the whole sequence. HOTA instead checks the complete histories behind every box match, including matches involving the player’s other predicted IDs.
For our fixed set of box matches, detection accuracy is about 0.824 and association accuracy is about 0.383. HOTA combines them using a geometric mean, which means multiplying the two components and taking the square root:
\[ \mathrm{HOTA}=\sqrt{\text{detection accuracy}\times\text{association accuracy}} \approx\sqrt{0.824\times0.383}\approx0.562. \]
This is the calculation at one evaluation IoU threshold. The full HOTA metric repeats it over several thresholds and averages the resulting HOTA values. The geometric mean is calculated at each threshold before averaging; it is not generally the geometric mean of the two separately averaged components.
For numerical comparisons, a standard evaluator such as TrackEval implements these measures, including their matching and scoring rules. This evaluation compares tracker outputs with annotations; it is separate from the track–detection assignment inside our tracker. In particular, the evaluation IoU threshold has a different role from our tracking acceptance threshold of 0.30.
We can now return to the basketball tracks. The table below uses the saved, independently started frames 50–100 runs, with the same 306 annotated boxes in each run. IDF1 and MOTA use evaluation IoU 0.50; HOTA is averaged over the standard 19 thresholds from 0.05 to 0.95. The ID-switch column gives the switches counted by TrackEval’s CLEAR evaluation, as used in MOTA.
| Confidence cutoff | Tracking method | IDF1 | MOTA | HOTA | ID switches |
|---|---|---|---|---|---|
| 0.50 | Last-box | 0.8391 | 0.9118 | 0.6758 | 4 |
| 0.50 | Two-observation motion | 0.8391 | 0.9150 | 0.6793 | 3 |
| 0.40 | Last-box | 0.9115 | 0.9314 | 0.7153 | 1 |
| 0.40 | Two-observation motion | 0.8590 | 0.9248 | 0.6703 | 3 |
Bold marks the best values within each confidence group, including ties. Higher scores and fewer switches are better.
At confidence cutoff 0.50, motion removes the frame-66 identity switch, reducing the count from four to three. MOTA increases by \(1/306\), while IDF1 stays unchanged. HOTA also increases slightly. At 0.40, two-observation motion scores below last-box tracking on all three measures.
HOTA uses sequence-wide identity information to help choose its within-frame box matches. Its accepted matches can therefore change when track IDs change, even with identical supplied boxes. Its detection component need not use the same box matches as our earlier detection precision and recall. At cutoff 0.50, HOTA’s detection component increases while its association component falls slightly when averaged over the thresholds, so the small HOTA increase should not be described as an improvement in the association component.
We should compare methods on the same annotated sequences and state which inputs and settings change. Holding the detector outputs fixed, as in our motion comparison, helps isolate the effect of the tracking method.