11 Motion-based tracking
11.1 Predicting the next box
We can estimate a track’s velocity from the centres of two recent boxes. For this example, we use the original confidence cutoff of 0.50 and examine T2’s boxes in frames 50 and 51.
For a box with edges \(x_{\mathrm{left}}\), \(y_{\mathrm{top}}\), \(x_{\mathrm{right}}\) and \(y_{\mathrm{bottom}}\), its centre is
\[ \mathbf c = \begin{bmatrix} (x_{\mathrm{left}} + x_{\mathrm{right}})/2 \\ (y_{\mathrm{top}} + y_{\mathrm{bottom}})/2 \end{bmatrix}. \]
The centres of A3 and B3 are:
| Frame | Detection | Centre \(x\) (pixels) | Centre \(y\) (pixels) |
|---|---|---|---|
| 50 | A3 | 568.576 | 483.396 |
| 51 | B3 | 574.482 | 478.432 |
These observations are one frame apart. We estimate the velocity as
\[ \mathbf v = \frac{\mathbf c_{51}-\mathbf c_{50}}{51-50} \approx \begin{bmatrix}5.906\\-4.964\end{bmatrix} \quad\text{pixels per frame}. \]
This estimates movement of 5.906 pixels to the right and 4.964 pixels upwards per frame. For observations several frames apart, we divide the displacement by that frame gap.
A constant-velocity model carries this velocity forward. The predicted centre for frame 52 is
\[ \hat{\mathbf c}_{52} = \mathbf c_{51} + (52-51)\mathbf v \approx \begin{bmatrix}580.39\\473.47\end{bmatrix}. \]
We keep B3’s width and height fixed, adding about 5.906 to its left and right coordinates and subtracting about 4.964 from its top and bottom coordinates.
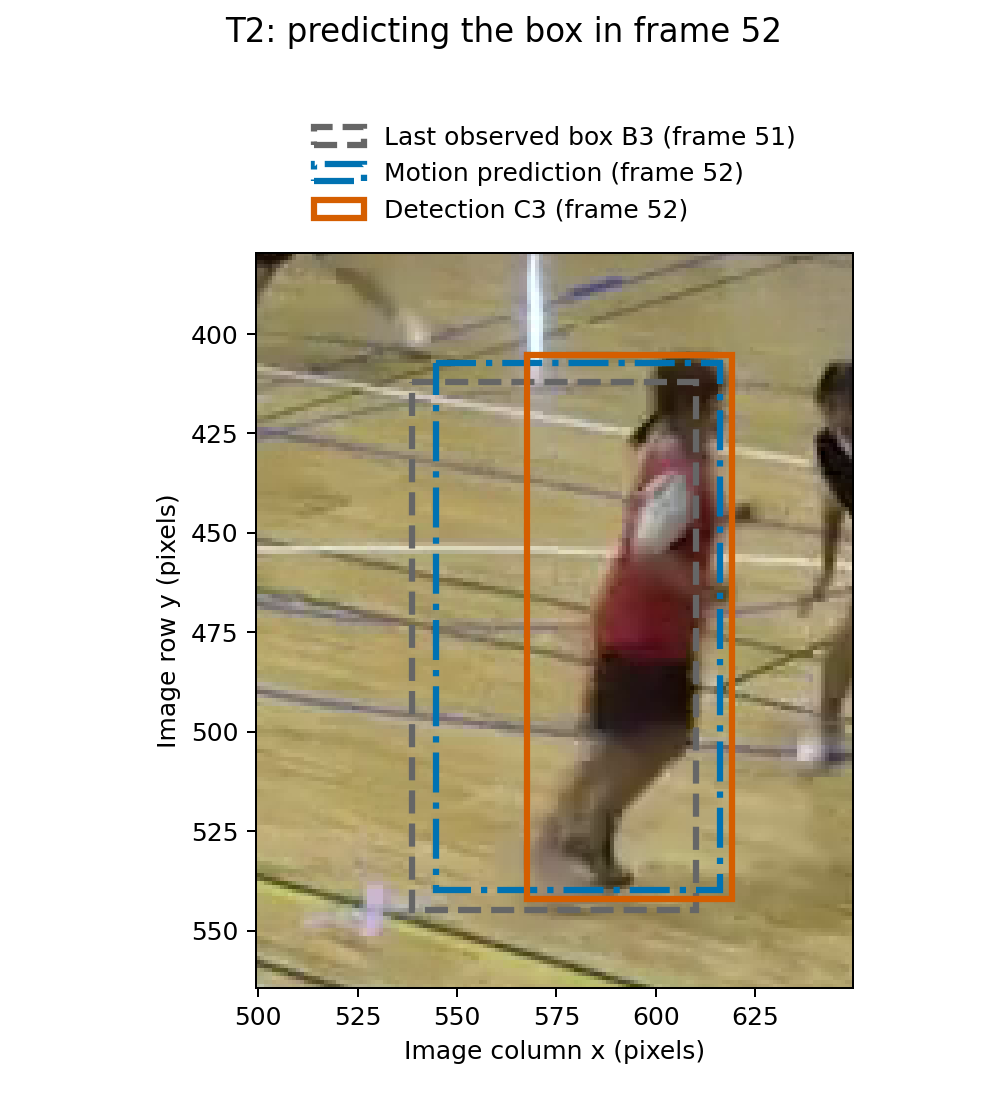
We can now compare the predicted box with the retained detections in frame 52. Its IoU with C3 is approximately 0.63, compared with 0.50 when we use B3 unchanged. C3 is the only retained detection with positive overlap with this prediction.
The same calculation for T4 gives a different result:
| Track | Detection in frame 52 | IoU using the last observed box | IoU using the predicted box |
|---|---|---|---|
| T2 | C3 | 0.50 | 0.63 |
| T4 | C5 | 0.93 | 0.77 |
For T4, the prediction overshoots C5’s centre to the right. The player’s motion can change between frames, and the detected boxes vary too. We next need to update our position and velocity estimates using the new detections.
11.2 Using the motion prediction
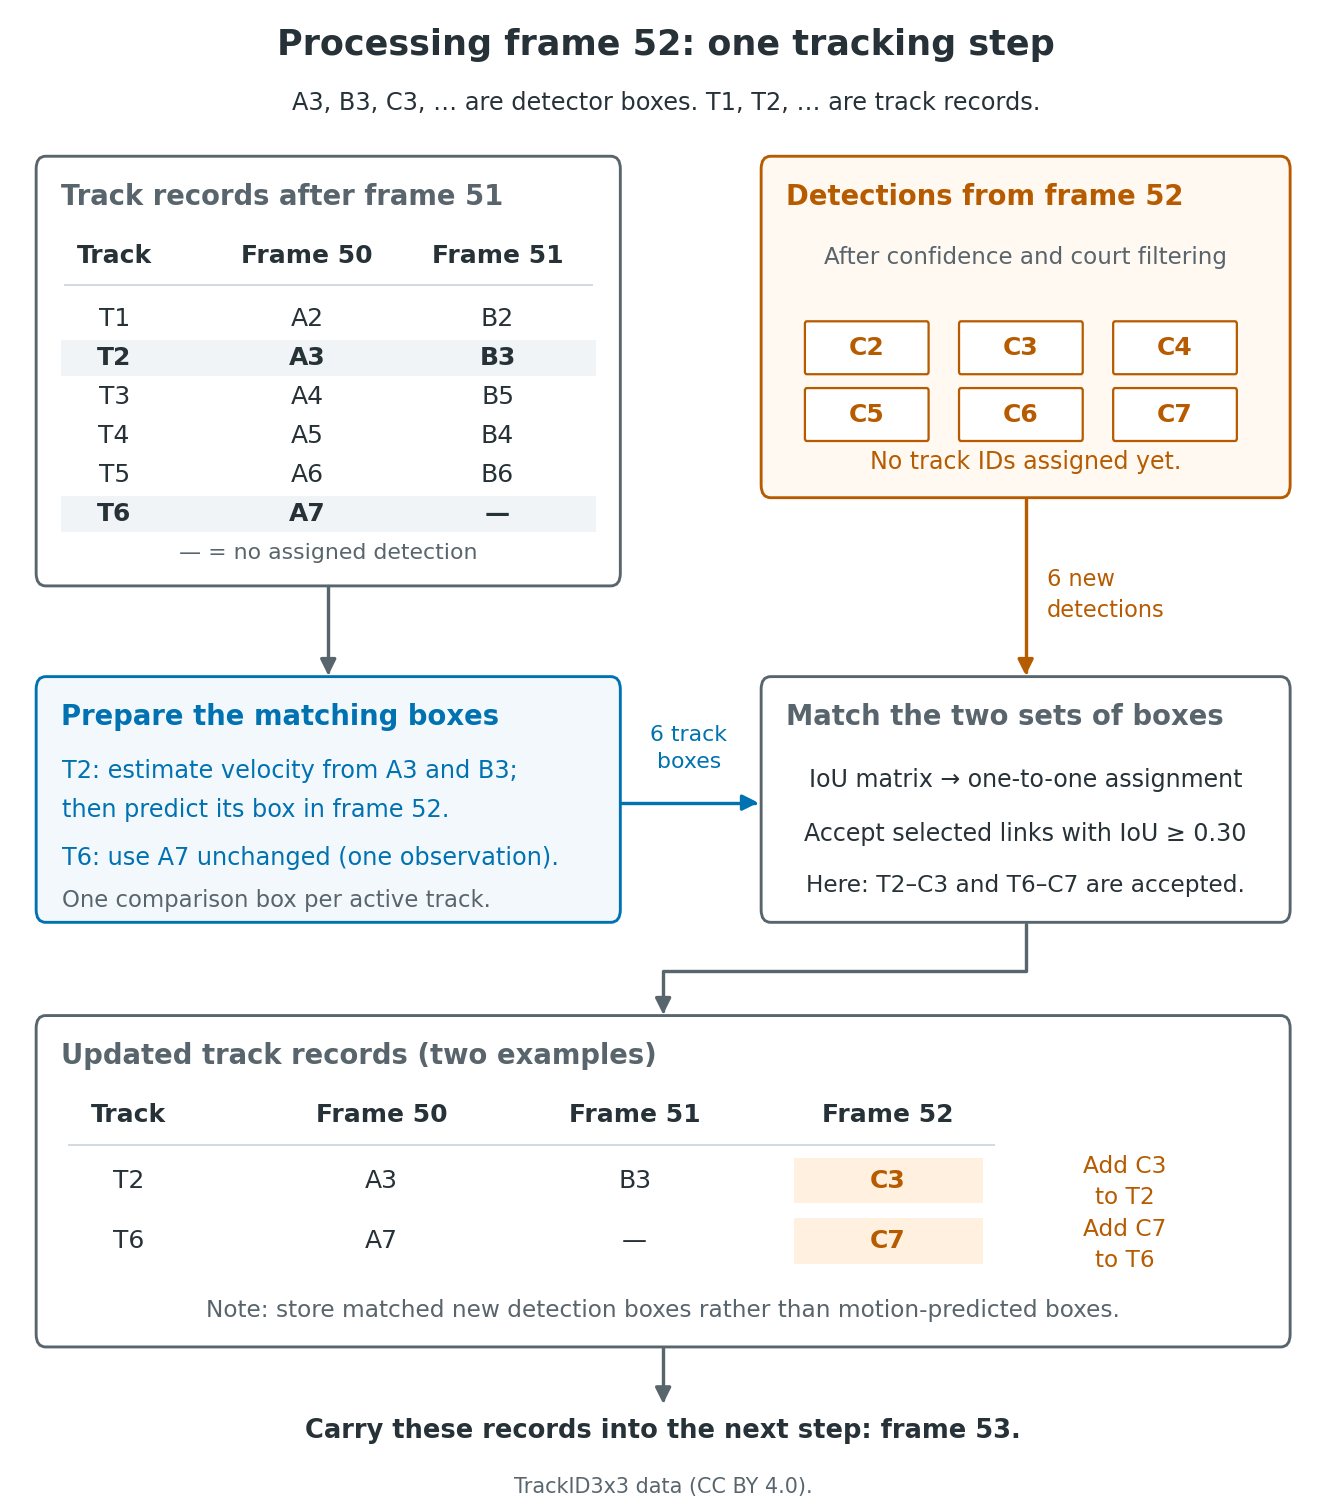
In our online approach we process the video one frame at a time. For each new frame, we use each track’s earlier detections to form a box for comparison with the current detections. We then match detections to tracks and update their records. We carry these updated records, including the newly associated detections, forward when processing the next frame. This repeated sequence is the tracking loop.
Until now, the IoU calculation has compared each new, not-yet-associated detection with an active track’s last observed box, using that box to represent the tracked object. We now consider how we might improve the box representing the tracked object for comparison with the current detections.
First, consider the track record. This contains a track ID and the detections assigned to it in earlier frames. For example, when we begin processing frame 52, T2’s record contains A3 from frame 50 and B3 from frame 51. As in the preceding section, we use these two observations to estimate T2’s velocity and predict its box in frame 52 using the constant-velocity model.
If we don’t have enough past detections assigned to a track to estimate its velocity, we use its most recent detected box unchanged for matching. For example, T6 has only A7 from frame 50, with no assigned detection in frame 51, so we use A7 unchanged for matching in frame 52.
We prepare a box to represent the object associated with each active track, using that track’s history. If a record contains more than two assigned detections, we use the two most recent ones to estimate velocity. They need not come from consecutive frames: we divide the change in centre position by the number of frames between them. We then compare all these boxes with the new detections C2–C7 using the same one-to-one IoU assignment and minimum-IoU rule as before.
For T2, we compare its motion-predicted box for frame 52 with C3, giving IoU 0.63. For T6, we compare its unchanged A7 box from frame 50 with C7, giving IoU 0.88. The assignment selects both links, and both pass our threshold of 0.30. We add C3 to T2’s record and C7 to T6’s record as their frame-52 observations, keeping their detected coordinates. That is, the observations we associate with the tracks are the actual detections, not the predicted boxes. T6’s empty frame-51 entry stays empty.
After frame 52, T2’s history contains A3, B3 and C3. To predict its box in frame 53, we use the two most recent observations, B3 and C3. Their horizontal centres are approximately 574 and 593 pixels, giving
\[ v_x \approx \frac{593-574}{52-51} =19\quad\text{pixels per frame}. \]
Starting from C3, our horizontal-centre prediction for frame 53 is then
\[ x_{\mathrm{predicted},53} \approx 593+19=612\quad\text{pixels}. \]
We apply the same calculation to the vertical centre coordinate and keep C3’s width and height when forming the predicted box.
T6 now also has two assigned detections, A7 from frame 50 and C7 from frame 52, despite having no assigned detection in frame 51. Its velocity estimate is therefore the change in centre position divided by 2, not 1. We use C7’s position plus one frame of this estimated motion to predict its box in frame 53.
We then match the frame-53 comparison boxes to the frame-53 detections and update the records again. The rules for unmatched tracks and new detections are unchanged.
11.3 Does the motion prediction help?
We can compare the two tracking methods over frames 50–100. Both receive the same detections, selected using the confidence cutoff of 0.50 and the court filter. We also keep the tracking IoU threshold of 0.30 and the three-miss inactivity rule unchanged. The only difference then is whether we compare new detections with the last observed boxes or with motion-predicted boxes.
At frame 64, T2 labels the player in red and T4 labels the player in black in both runs. Neither track is assigned a detection in frame 65. The saved boxes around the red and black players have confidence scores of about 0.43 and 0.48, respectively. They have passed NMS and would pass the court filter, but both fall below our confidence cutoff of 0.50.
In both runs, at frame 66 there is a retained detection around the player in red, with confidence about 0.59. Other saved boxes overlapping this pair of players fall below the confidence cutoff, so each tracker receives only one retained detection for the pair. The two trackers assign this same detection to different tracks, as shown below.
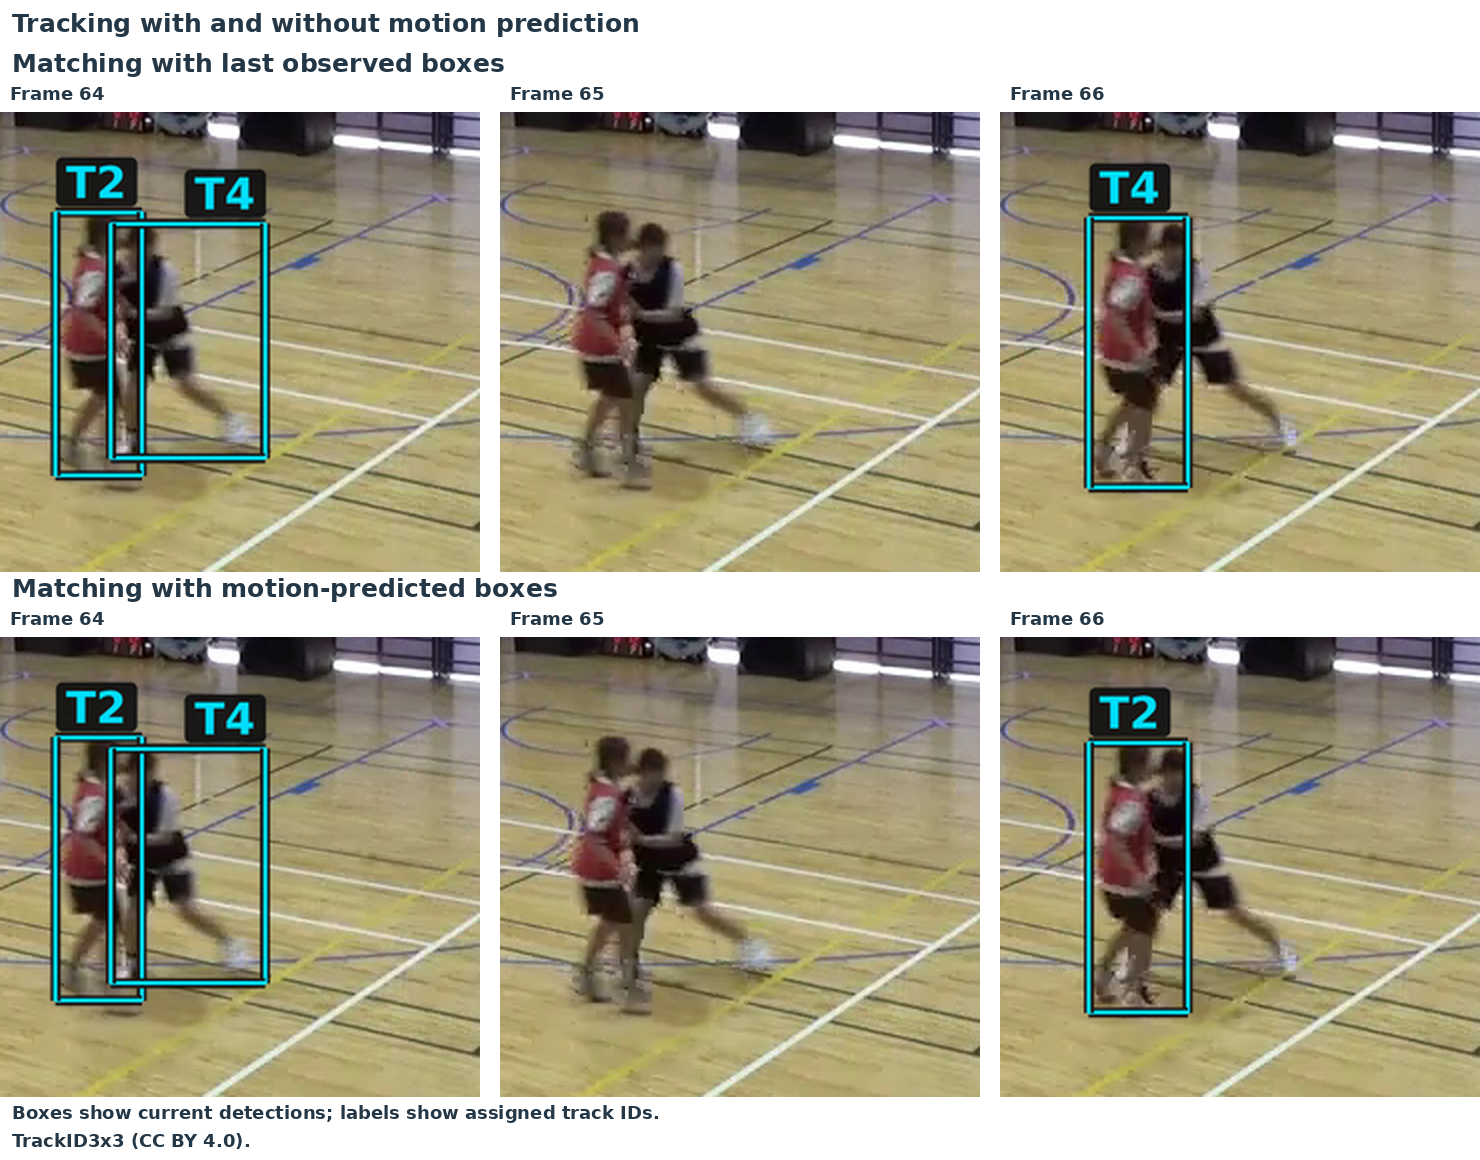
For this frame-66 detection (around the player in red), the IoUs are:
| Track | IoU with last observed box | IoU with motion-predicted box |
|---|---|---|
| T2 | 0.38 | 0.73 |
| T4 | 0.40 | 0.00 |
With last-box matching, the one-to-one assignment gives this detection to T4, which was following the player in black. With motion prediction, the assignment instead gives it to T2, which was following the player in red. Both selected links pass the threshold of 0.30.
Here, motion prediction allows T2 to continue following the player in red across the gap. Note that T2’s frame-65 entry still remains empty.
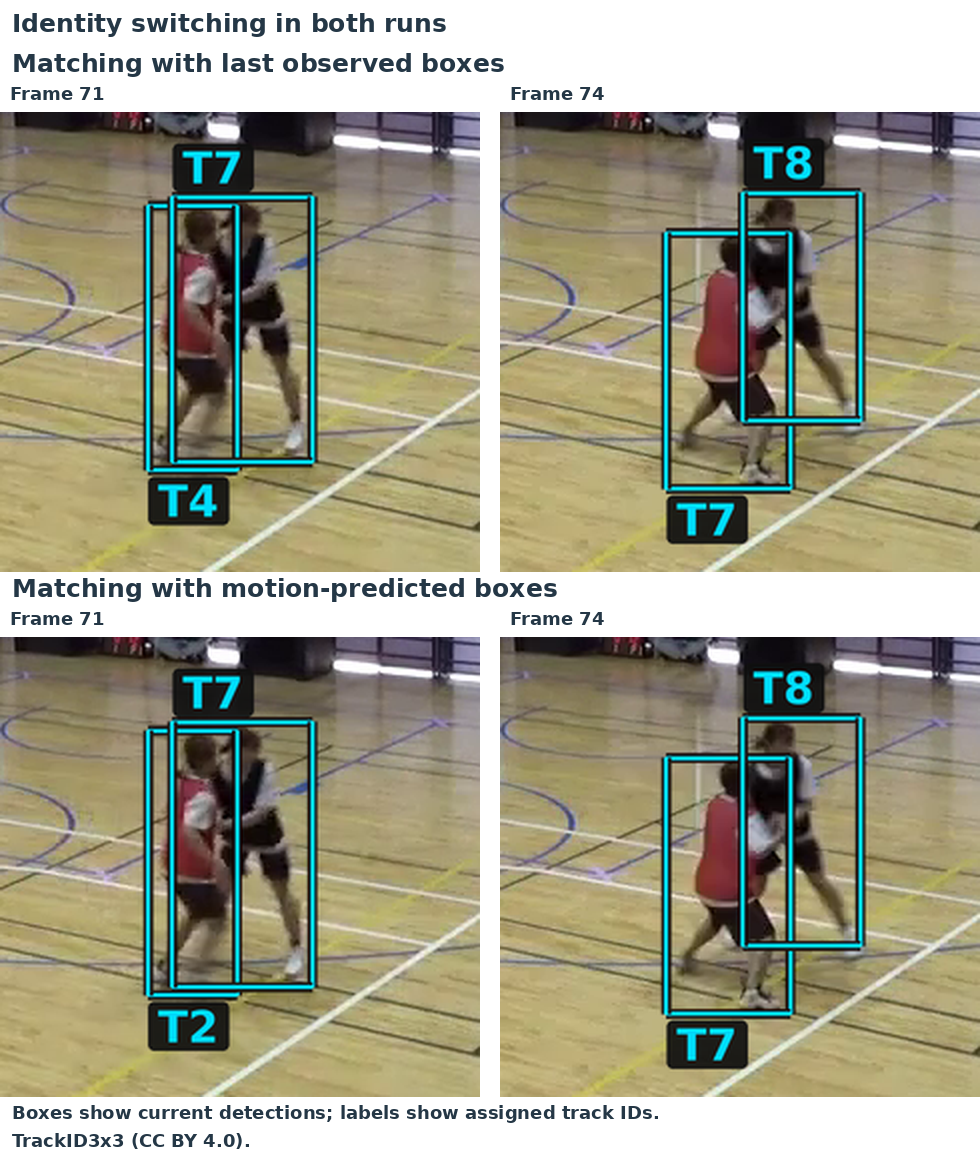
Motion prediction avoids the frame-66 switch, but the frame-74 switch we examined earlier still occurs in both runs. T7 labels the player in black at frame 71, but the player in red by frame 74. The detection around the player in black starts a new track, T8.
11.4 Changing the confidence cutoff
We have already seen that changing the confidence cutoff will change the detections available to the tracker. To investigate, we can consider using a confidence cutoff of 0.40 for detections instead of 0.50 throughout frames 50–100. We keep the court filter, tracking IoU threshold of 0.30 and three-miss inactivation rule the same.
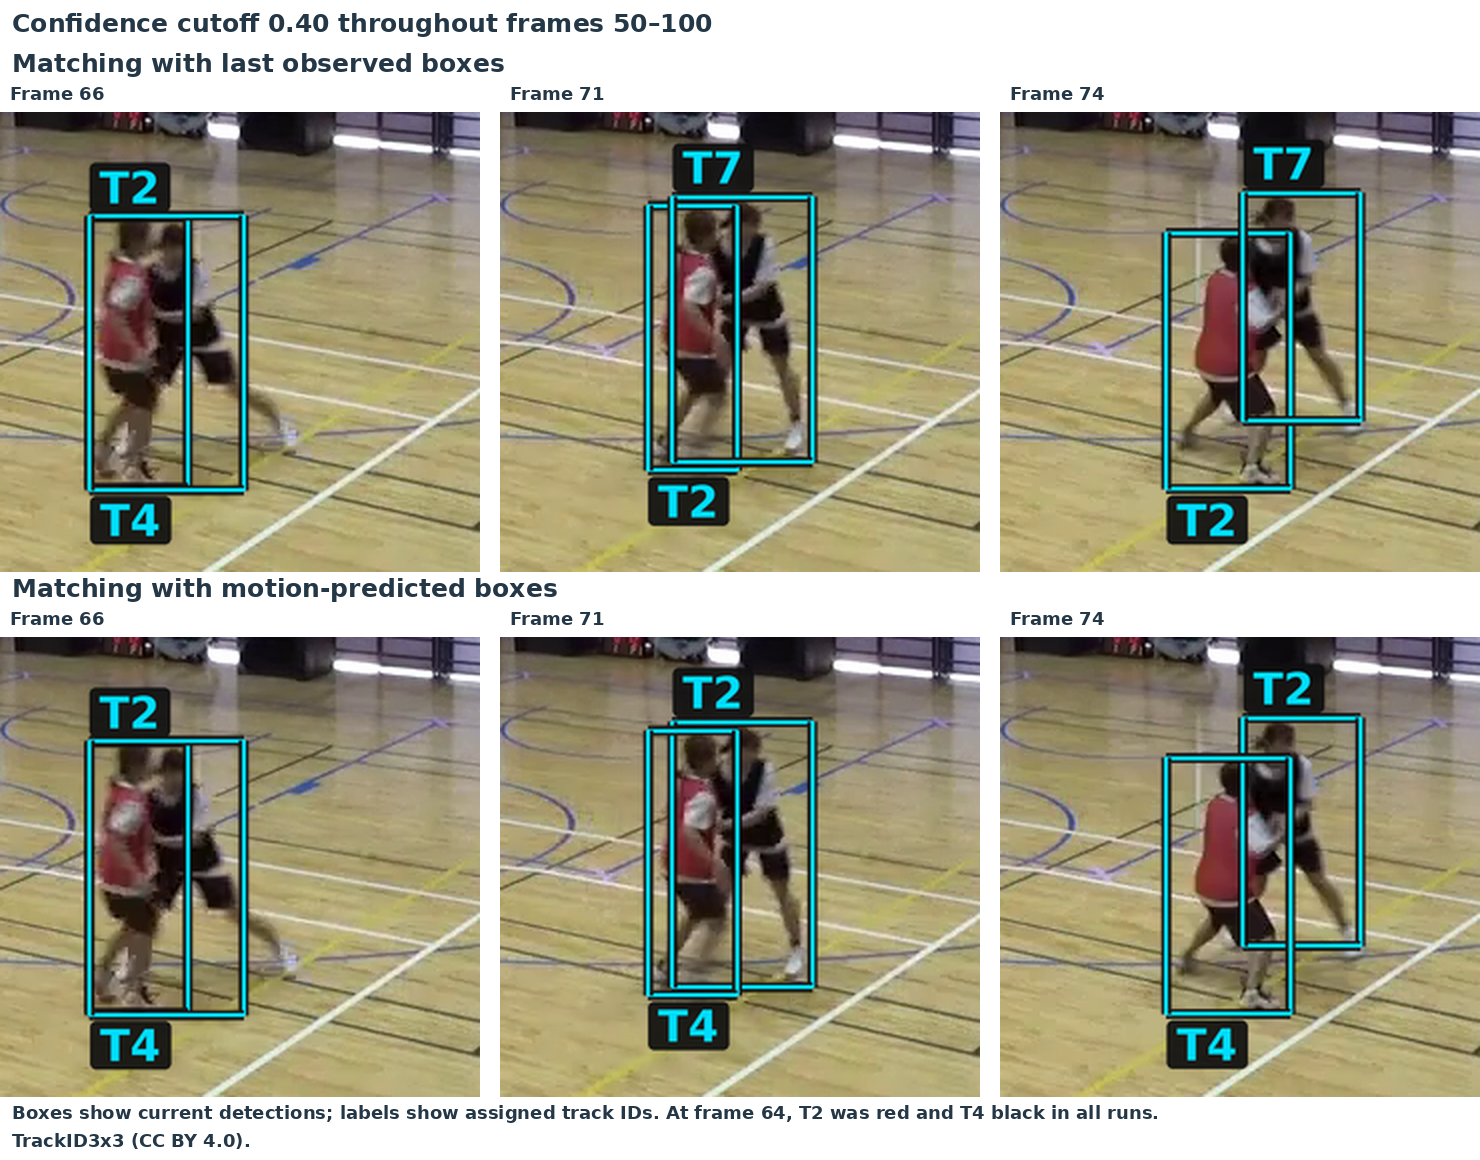
The two boxes around the red and black players in frame 65, with confidence scores of about 0.43 and 0.48, are now both retained. Both trackers assign them to T2 and T4, respectively. In frame 66, both methods now assign the red-player detection to T2. Thus, with these additional observations, even last-box matching avoids the frame-66 switch seen at the higher cutoff.
The switch between frames 71 and 74 is also no longer present in either run at 0.40. However, the motion run has already switched earlier: T2 labels the player in red at frame 66, but the player in black by frame 71, while T4 labels the player in red. These incorrect labels remain at frame 74.
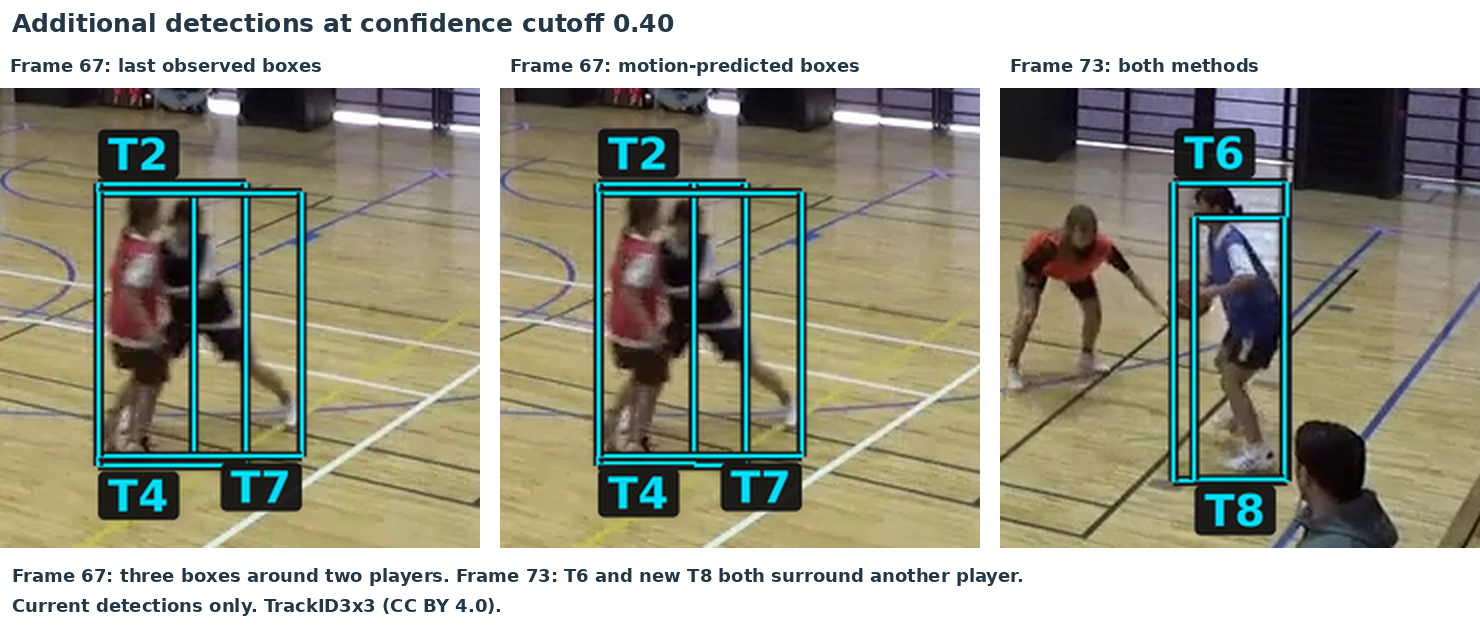
Not all the additional detections are useful. At frame 67, the lower cutoff retains three boxes around these two players, including a broad box overlapping both. At frame 73, it also retains a second box around another player who already has a detection assigned to T6. In both runs, the additional box starts a temporary duplicate track, T8.
Lowering the cutoff can therefore recover useful observations, but it can also introduce detections that make tracking harder. The original SORT paper emphasises that detection quality is a key factor influencing tracking performance. Here confidence cutoff is one choice that affects which detections reach the tracker, though no choice, whether higher or lower, is obviously better in the present example.